Wednesday, March 31, 2010

RELATIVE VOLATILITY 10YR NOTE TO SP500


In some earlier posts I discussed dissipative systems and entropy. For purposes of this post I will use the interaction of two open and dissipative systems, the US bond market (10 year notes) and the US stock market (SPY). In addition, I am making some assumptions. The first is that I like to think of entropy in the markets as equivalent to the amount of information and uncertainty that exists. The second is that higher standard deviation is equivalent to higher entropy. A higher standard deviation means prices are more variable and erratic. This is a result of more uncertainty, and consequently, more entropy in the market. In addition, this can also be thought of in reverse--less risk leads to less uncertainty, and consequently, less entropy.

In general, standard deviation is used as a measure of volatility in a market. Markets become more volatile as the level of uncertainty grows. I have created two graphs which show the standard deviation of both markets since the beginning of 2007. One graph shows that if the relative volatility is greater than 1, then stock prices have a higher level of entropy compared to bond prices. If less than 1, then bond prices have more entropy than stock prices. The second graph shows the actual standard deviation of each market. Two quick conclusions can be made from these charts. The first is that volatility has significantly declined in both markets since the height of the financial crises, and second, the volatility in bonds is higher relative to stocks. More next time…

Tuesday, March 30, 2010

Large Traders


Attached is a daily chart of the SP500 provided by FINVIZ.COM, a site I think does a good job of presenting financial data. What I find interesting in this chart is the bottom two graphs, particularly the red line. The red line is the COT report of positions held by large traders. Since the middle of January 2010 large traders have been taking opposite positions in the large contract vs. the Emini. This is odd, but I have learned over the years that many things in the market do not make sense when we try to rationalize what is happening. The other thing I have learned is that when something seems odd you better pay attention; there might be more going on then you can tell. One last observation is that in both contracts large traders are right near the zero line. My conclusion from all this is that we are probably going to get a breakout in some direction pretty soon. Let's see how this plays out...

Monday, March 29, 2010

DISSIPATIVE SYSTEMS

In some earlier posts I discussed open and closed systems as they relate to thermodynamic principles. Open systems continuously interact with their external surroundings by constantly exchanging energy, matter, and information beyond their boundaries. Closed systems, however, do not exchange energy, matter, or information with their external environment.

Most systems and organisms found in nature tend to be open systems. Open systems tend to be non-equilibrium systems because of the constant exchange of energy, matter, or information with their external surroundings and/or other systems. In general, the field is called non-equilibrium thermodynamics.

Some concepts borrowed from non-equilibrium thermodynamics seem to explain the market and its dynamics well. The stock market can be thought of as an open system that interacts with other systems and external factors. For example, other systems could be the bond market, or US dollar market, and some external factors are human beings, money, supply, demand, perceptions and expectations. The stock market, in my opinion, also never reaches a state of equilibrium because of its open nature and constant interactions with all these other external factors and other systems.

Open, non-equilibrium systems are also called dissipative systems. Dissipative systems were studied by Ilya Prigogine, a Nobel Prize winner. Mr. Prigogine concluded that dissipative systems, or structures, maintain stable and low entropy states by importing material and energy across their boundaries. These systems will then transform or degrade the energy or matter by performing some process on it. This cycling tends to increase the flow of energy and/or the process may move at a faster rate. This, in turn, may increase complexity and self-organization can also occur. In addition, dissipative systems or structures can export or dissipate entropy into their surroundings. That’s enough for today…more on this in future.

Saturday, March 27, 2010

THERMOECONOMICS 2

Thermoeconomics is a term I've come across lately. Thermoeconomics is the study and application of thermodynamic principles to economic concepts. For example, thermodynamic concepts such as heat, work, energy, and entropy would be applied to economic theories of production, consumption, and distribution. This seems like an interesting area of study that I will be researching as I go along.

On a different note, we had one trade this week for a 2.25 point gain.

Thursday, March 25, 2010

AUTOMATED STOCK TRADING PROGRAM SP500

We have created a computer program which is a variation of one of the trading models that we use to trade the SP500 futures. We run the program each morning on all the individual stocks comprising the SP500. We hope to eventually create a fully automated trading program with it. The study began in October 2008 and is ongoing. We will post our daily and historical results here.

AUTOMATED INSTITUTIONAL STOCK TRADING PROGRAM FOR SP500

VIX

Bloomberg recently published a story on the VIX indicator. The story discussed the findings of Birinyi Associates and VIX. Birinyi concluded that it does not work as a market timing tool. The VIX indicator measures volatility and is generally thought of as a measure of “fear” or “complacency” in the market.

I too have researched VIX in the past as a possible market timing indicator. I studied and backtested my own ideas. I researched and backtested Laurence Connors’ ideas. I tried all sorts of variations. One idea that I thought was great was trying to measure extremes in VIX by using Bollinger Bands on it, etc. Nonetheless, I too concluded that VIX was not helpful for my trading and I agree with Birinyi.

One idea I can share with readers is that many traders make the mistake of looking at the VIX’s absolute levels and comparing those to the past. This is nice, but this approach, or any other, will probably lead you to the same conclusion I came to.

Wednesday, March 24, 2010

THERMO ECONOMICS

If you have been following any of my recent posts you will know that I have been researching the second law of thermodynamics and how it may be related to market dynamics. It is so interesting to research new concepts and ideas. We discover or learn something new, and this usually leads us to more questions, discoveries, or ideas, etc.

The process led me to something completely new—thermo economics. Have you ever heard of this discipline within economics? I just cannot believe that I never even came across the term, never mind what is studied in it. I studied economics when I was in high school, by this I mean I read The Wall Street Journal, (no high school at that time would consider a course in economics, thank God!), I studied it in college, and also in business school, but I have never heard of thermoeconomics. More on this topic in the future.

Tuesday, March 23, 2010

OUR PROPRIETARY VOLATILITY INDICATOR


We have tested this statistic going back to the 1950's on the SP500 Cash Market. Above I have placed 3 graphs of varying time lengths. As can be seen by the graphs, when our volatility statistic is above .95%, the market has "high volatility," and below .95 it has "low volatility." The higher the number, the more volatile the market, the lower the number, the less volatile the market. Over the long term this statistic is quite accurate in defining the underlying volatility of the market. I have never had much success with any other indicators or calculations of volatility. The way we use this figure is that we change our stops when the volatility goes above or below the .95% threshold. We will publish our figure each Friday in the Volatility Statistic page above.

Monday, March 22, 2010

VOLATILITY CLUSTERS AND PERSISTS


This is a graph I produced of the daily range of the SP500 Emini futures from July 2002 to the end of last week. The lesson is that volatility clusters and persists. A comparison of 2004-2006 ranges to 2007-2008 ranges clearly shows how the ranges when low, stayed generally low for a couple of years. Likewise, when the ranges began to expand at the end of 2007 through 2008 they tended to continue to stay large for a couple of years. Large ranges and high volatility are a double-edged sword. They can bring large gains but also large losses. The key is to try to understand when the underlying volatility conditions of the market are changing and to modify your trading plan. For example, using different stops or adjusting position sizes.

Sunday, March 21, 2010

ZZJOKE.COM

My partner has created a great site for jokes called ZZJoke.com. From time to time I'll post some. The link can also be found on our sidebar.

Jon and Brett were in a mental institution. This place had an annual contest picking two of the best patients and gives them two questions. If they got them correct, they're deemed cured and free to go.

Jon was called into the doctor's office first and asked if he understood that he'd be free if he answered the questions correctly.
The doctor said, "Jon, what would happen if I poked out one of your eyes?" Jon said, "I'd be half blind."
"That's correct. What if I poked out both eyes?"
"I'd be completely blind."

The doctor stood up, shook Jon's hand, and told him he was free.

On Jon's way out, as the doctor filled out the paperwork, Jon mentioned the exam to Brett.
He told him what questions were going to be asked and gave him the answers.

So Brett came in. The doctor went through the formalities and asked, "What would happen if I cut off one ear?"
Brett, remembering what Jon had said was the correct answer said, "I'd be half blind."
The doctor looked a little puzzled, but went on.
"What if I cut off the other ear?"
"I'd be completely blind," Brett answered.

"Brett, can you explain how you'd be *blind*?"

"My hat would fall down over my eyes..."

Saturday, March 20, 2010

ENTROPY

I have been studying the Second Law of Thermodynamics. One example of the Second Law is how particles in a gas, when heated, tend towards increasing randomness and disorganization as they move towards a state of equilibrium. A generalization of the Second Law is that entropy increases.

Scientists define systems as closed or open and moving towards equilibrium or not. Measuring the movement and position of particles in a gas was viewed from the perspective of a closed system. In contrast, measuring the movement and position of financial prices in a market can be thought of from the perspective of an open system that does not move towards equilibrium. What is equilibrium in the market anyway? Sideways price movement? Narrow range price bars or range trading over a particular time period? A price where seller and buyer agree?

One can make the argument that entropy is similar to information content. If we have less information, then we have more uncertainty, and vice versa, the more information we have, the more we know, the less uncertain we are. Thus the amount of entropy in a system is similar to the amount of uncertainty that exists. What I find very interesting is that if maximum entropy occurs in a closed system when equilibrium is reached, then maximum uncertainty would also occur at equilibrium. Somehow, this seems counter-intuitive. One would think that as equilibrium is reached, that things “settle down,” stabilize, and should theoretically be more known or certain. I need to think more about this.

On a different note, there were no trades this week. These three trading models can be quite boring sometimes.

Tuesday, March 16, 2010

SECOND LAW OF THERMODYNAMICS


I am currently studying the Second Law of Thermodynamics. I do this kind of thing all the time. I frequently study and try to understand concepts, theories, or ideas from other disciplines. Once I think I have a handle on the subject matter I try to apply it to the behavior of prices and market dynamics. Most of the time I go nowhere with this stuff, in terms of the how the market behaves, nonetheless, the pursuit is worthwhile. I’ll be posting more on this over the next few days…

Monday, March 15, 2010

Go With The Flow

“Fare thee well now, let your life proceed by it's own design.
Nothing to tell now, let the words be yours, I'm done with mine.”


-LYRICS TO “CASSIDY”

Sometimes we listen to our music hundreds of times and not recognize consciously what the lyrics are stating. This happened the other day to me. These lyrics really “hit home” as I was listening to this song, played by The Grateful Dead.

This is good advice. Sometimes it seems that we try so hard to determine the direction our lives should take. Not only that, but the harder we try, the further away we get from our goals. Sometimes it’s just best to go with the flow and let what will be, be.

Let the words be yours, I’m done with mine...

Saturday, March 13, 2010

Bongard Problems


Mr. Mikhail Bongard is a Russian computer scientist that was mentioned in Mr. Douglas Hofstadter’s book, Godel, Escher, Bach: An Eternal Golden Braid. Mr. Bongard is known for his book on pattern recognition. His book contains 100 examples of Bongard problems. Here’s a link…. The general idea behind all of these problems is that there are fundamental cognitive principles that take place in solving them. By studying these problems one can begin to get a glimpse of the underlying structures of our thought processes. In addition, they can also drive you crazy.

Perhaps by studying these pattern recognition problems we can gain some conceptual understanding of the principles of pattern formation. This, in turn, may be helpful to us in our quest for patterns in the market.

On a different note, we had one X sell trade this week for a small .50 gain.

Friday, March 12, 2010

Tit-for-Tat

In Mr. Douglas R. Hofstadter’s book, Metamagical Themas: Questing for the Essence of Mind and Pattern, he discusses a computer competition that was held by Mr. Robert Axelrod. Mr. Axelrod held this competition in 1979. He invited professional game theorists and people who were interested in the Prisoner’s Dilemma to a computer program competition. Various computer programs were programmed to compete against each other in an iterated series of Prisoner’s Dilemma situations. The winner was a program called TIT-FOR-TAT, written by Anatol Rapoport.

Who cares? Well… the philosophical implications of this program winning a competition of this sort is extremely interesting. First, TIT-FOR-TAT was a simple program. It had just a few lines of code. It competed against other programs that were more complex and with more lines of code. Second, the strategy it employed was the following:

Cooperate on Move 1;
Thereafter, do whatever the other player did the previous move.


Mr. Hofstadter states that two key strategies came about from the first tournament. “The lesson of the first tournament seems to have been that it is important to be nice…and forgiving…” Hmmm…A second tournament was held and once again TIT-FOR-TAT won. Mr. Hofstadter states, “the majority of participants in the second tournament really had not grasped the central lesson of the first tournament: the importance of being willing to initiate and reciprocate cooperation.” One other interesting outcome of the second tournament was that of the 15 top strategies, only one was not nice, and of the bottom fifteen strategies, only one was nice!

A third key lesson that was learned from the second tournament was that of provocability-if your counterpart defects and “screws you”, get mad quickly, and retaliate. Mr. Hofstadter says, “Be nice, provocable, and forgiving.”

Mr. Axelrod felt that strategies that do well in a wide variety of environments are robust. He also wrote, “TIT-FOR-TAT won the tournament, not by beating the other player, but by eliciting behavior from the other player which allowed both to do well.” Cooperation and win-win situations are preferable in our society. TIT-FOR-TAT’s wins also teach us to keep it simple, be nice, provocable, and forgiving, and maybe we too will succeed in our lives. Ahhh…philosophy, we Greeks just can’t seem to get enough of it.

Lastly, I cannot ignore Mr. Axelrod’s comment that strategies that succeed in a variety of conditions are robust. Well, I do not know about my trading models being nice, or provocable, or forgiving in the market, but I do know that they are robust--they better be. I also know this; adopting a TIT-FOR-TAT strategy in our lives is a good idea.

Thursday, March 11, 2010

Ants and Neurons Firing


I have recently finished reading Mr. Douglas Hofstadter’s book, METAMAGICAL THEMAS: QUESTING FOR THE ESSENCE OF MIND AND PATTERN. Mr. Hofstadter is also well known for his Pulitzer Prize winning book, GODEL, ESCHER, BACH: AN ETERNAL GOLDEN BRAID. Both books cover a wide variety of topics involving mathematics, art, linguistics, genetics, computer programming, artificial intelligence, etc. Today I would like to discuss one of the topics he writes about; statistically emergent active symbols.

Mr. Hofstadter states the basis of the concept of statistically emergent active symbols is in E.O. Wilson’s comment:

“mass communication is the transfer, among groups, of information that a single individual could not pass to another.”

He makes the analogy of how we process information and how ant colonies process information. Ant colonies function on a variety of levels, as does the human brain and its neural networks. The idea is generally that on the lower, neuron level, signals will be fired from one neuron to another along the network. This is similar to how each ant will pass messages along to other ants in the colony. We, however, at higher levels of thought, are not aware, or conscious, of any of the firings of neurons at the lowest levels. In Mr. Hofstadter’s view, once the actions that occur at the lowest levels come to a critical point, statistically emergent active symbols can be created at higher levels. These active symbols, in turn, will react with other active symbols, and eventually a pattern, idea, or thought arises at even higher levels. What is important is that the process of active symbol creation, from his perspective, takes place from the bottom-up, not from the top-down.

He also states, “each individual ant’s action has no interpretation in terms of the overall colony’s goals; only when many such actions are considered at once does their statistical quality then emerge as purposeful, or interpretable.” Applying this concept to the market, one can sense that any tick by tick change in price, may, in itself, have no interpretable meaning, however, when our perspective “goes up a level,” a meaning or order may emerge.

Mr. Hofstadter’s writings made me wonder about how statistically emergent active symbols can arise in the marketplace. Can it be that neuron firings, ants passing messages, and tick by tick movements in price work in similar ways?...probably. Is it possible that prices at the very lowest time frames begin to form statistically emergent symbols, or patterns, on higher level time frames? I think so. Should we research price behavior with a microscopic, bottom-up process? Or is a top-down, macroscopic approach better? This depends on each person’s perspective and interpretation of the market. And just for philosophical kicks, are we like ants in the higher level, universal picture? Just some food for thought.

Monday, March 8, 2010

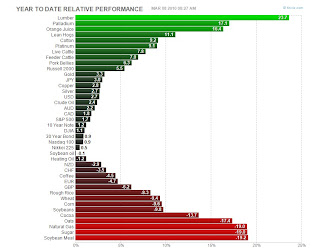
Market Views


Although we only trade the SP500 futures market, it is always interesting to view how other markets are performing. This picture comes from Finviz.com. They do a nice job.

Saturday, March 6, 2010

Richard Feynman: Physics is fun to imagine | Video on TED.com

Richard Feynman: Physics is fun to imagine | Video on TED.com

Feynman Rocks. Rolls. and Jiggles

TRADING PERFORMANCE

No trades this week. It has been more than a month since the last trade. That can happen with these trading models. Remember, patience is part of the process. For the months of January and February the models have had a loss of 4.25 and 3.25, respectively.

Drawdowns can last awhile and they are not fun.

Mandelbrot, Once More

“We cannot know everything--we can only think of the world as a black box. We can see what goes in and what comes out but not what happens inside; we can only draw inferences about the odds of input A producing output B. Seeing nature through the lens of probability theory is what is called the stochastic view.”

--Benoit Mandelbrot

Does this not hold true for all of us? Schrodinger’s Cat may be dead or alive. We learn so much as we progress through our lives, yet somehow more and more questions arise. The black box to me, from a trading perspective, is the price bar. It’s time interval does not matter, but when we look at it on lower and lower time frames chaos seems to unfold. How peaceful that daily bar can look--so simple, so straight, with its open and close; but when we venture deeper into it all hell breaks loose.

What’s a trader to do? Quantum theory tells us the best we can do is predict the probability of events occurring. I believe this also holds true for traders. The best we can do is determine the probability of an event occurring and then rely on our risk management strategies, particularly our money management. We really cannot know everything. We can never know what is going to happen in the market, but we can model the possibility of events occurring. The other thing we can do is to know, ahead of time, what we are going to do when and if the market price goes to x, or if it goes to y.

The market is complex and dynamic. Those peaceful price bars hide underlying chaos. Nonetheless, with perseverance, discipline, and solid research those price bars can also reveal order. It tends to lie in the probabilities.

Wednesday, March 3, 2010

Revisiting Mandelbrot


I’ve just finished re-reading one of the best books written about market prices and financial theory. The book is THE (MIS)BEHAVIOR of MARKETS by Benoit Mandelbrot and Richard L. Hudson. Mr. Mandelbrot is truly a remarkable man. Most people know him as the founder of fractal geometry and perhaps by the famous fractal image of The Mandelbrot Set. His work has been applied in a variety of sciences and disciplines ranging from astronomy, physics, biology, linguistics, mathematics, turbulence theory and many others. What many people do not associate with him, however, is the study of market prices and market structure theory. This book describes all his ideas of how markets (mis)behave and calls for new theories and ways of thinking about market prices for the future.

Mr. Mandelbrot’s ideas shake the foundations of some of the standard theories of finance we were taught in school; such as random walk, normal bell curve distributions, the Black-Scholes option pricing model, and CAPM. The following paragraph seems to best summarize all his ideas:

“the market has the turbulent parts that scale up to echo the whole. It has a multifractal spectrum that characterizes the scaling. It has a long term dependence so that an event here and now affects every other event elsewhere and in the distant future. It shows turbulence in a wild kind of variation far outside the normal expectations of the bell curve; in a concentration of changes here and there; in a discontinuity in the system jumping from one value to another; and in one set of mathematical rules that can, in large measure, describe it all.”

After reading this book I cannot help feeling how I used to feel when I listened to all my professors in business school. I never agreed with what they were teaching us. I think the current financial crises can, in some way, be attributed to those who did buy into those ideas. It is clear to me that Mr. Mandelbrot’s ideas will need to be considered as the basis for new theories in finance and financial markets as we move forward.

Tuesday, March 2, 2010

AN EMINI FUTURES TRADING VIDEO WITH TRADINGXYZ.COM

Here's a short video introducing our firm:

The bored trader creates a blog

So this is my first blog entry...

I like to walk in the woods when I get a chance and today after communing with nature I came home and decided that starting a blog would be a good idea. Why?
Because today is 3-2-10...BLAST OFF! why not start a blog today...

My partner and I will be starting up a new venture later on this year called TRADINGXYZ.com. Traders will eventually get to know us and maybe this blog can help, but really it's also because trading can be quite boring if you trade the way I do. Blogging may help me connect with others, pass the time, and crystallize my random thoughts. Maybe I'll even learn a thing or two....we'll see.